
Dashboard
The Dashboard page gives you quick access to your account numbers.
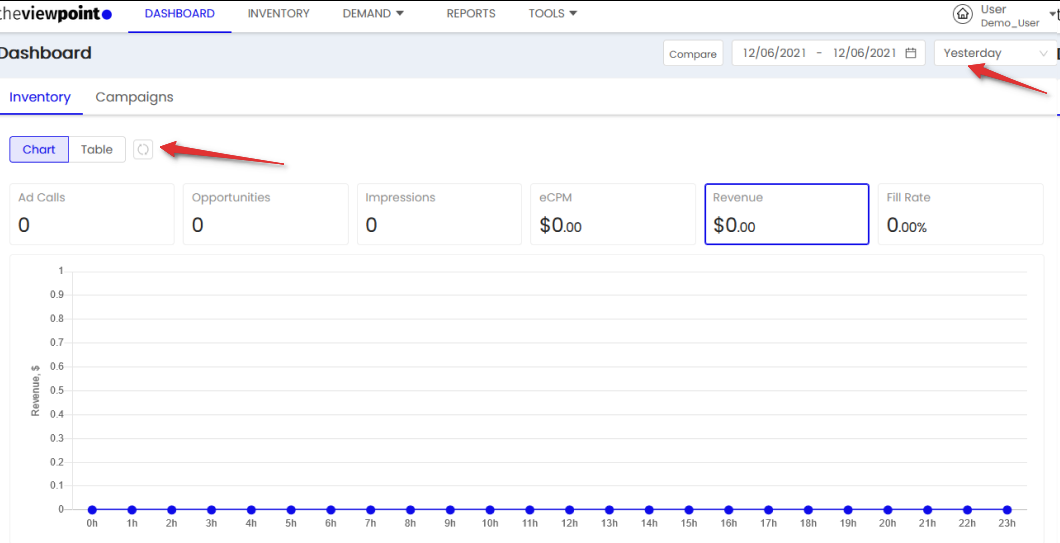
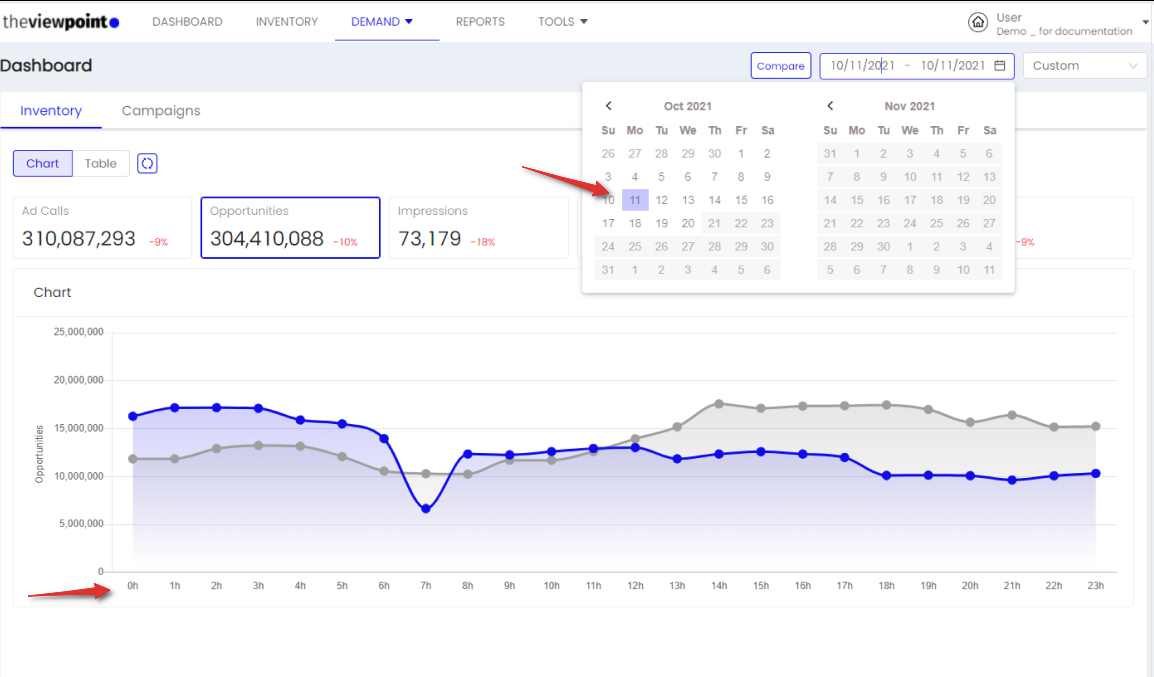
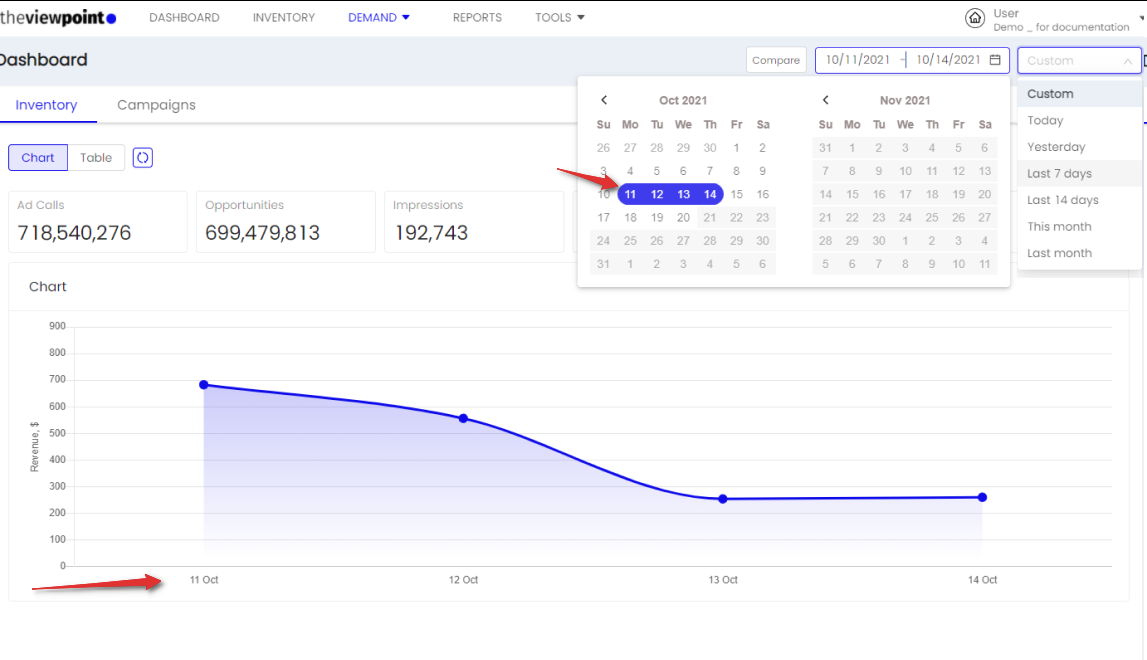
By default, the dashboard displays metrics for yesterday, but you can change the time range in the date picker.
.png?inst-v=79929b3c-3130-42cf-a529-8d28c77e98d2)
The "Refresh table data" option is available when using presets or a custom date range without today selected.
If you've selected today, this month, or a custom range including today, the "refresh" function will be disabled.
You can switch between the Inventory and Campaigns tabs to view relevant metrics.
The dashboard displays all the most important information, including data for the selected period and comparisons of different periods.
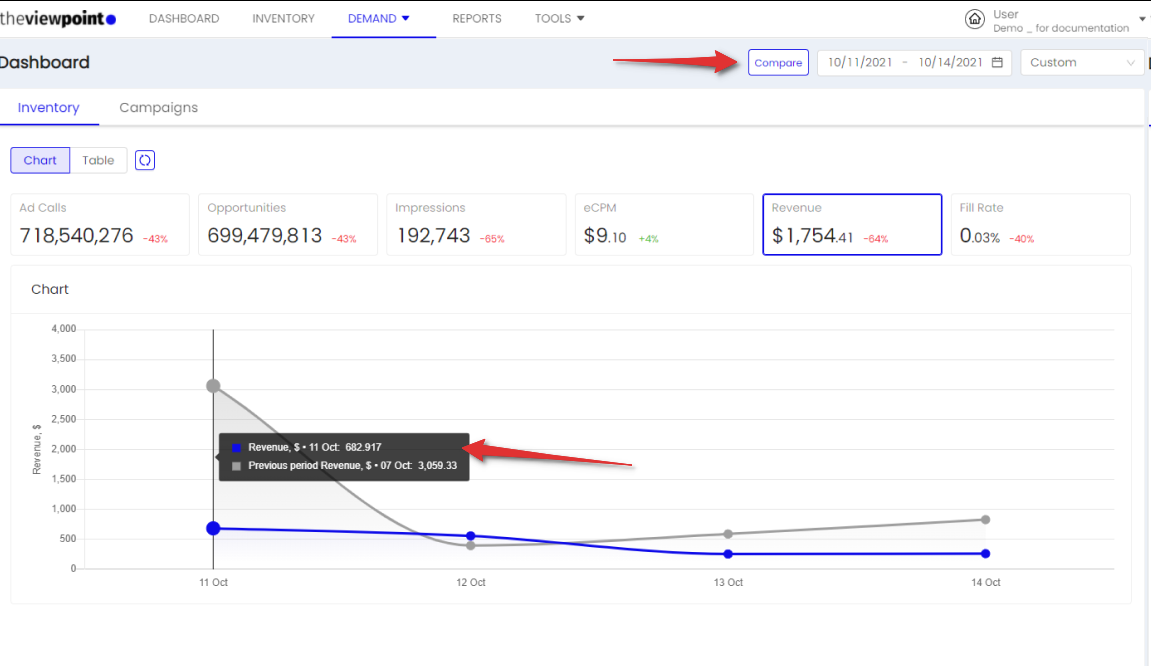
You can select any metric to view information on it directly by clicking on it in the dashboard panel.

When comparing indicators with yesterday, incomplete data for the current day is compared with the corresponding hours for the previous day.
For example, if for today we look at the moment of 9 am, then compare with the previous day for 9 hours
The "Refresh" button at the top of the dashboard allows you to update the information immediately.
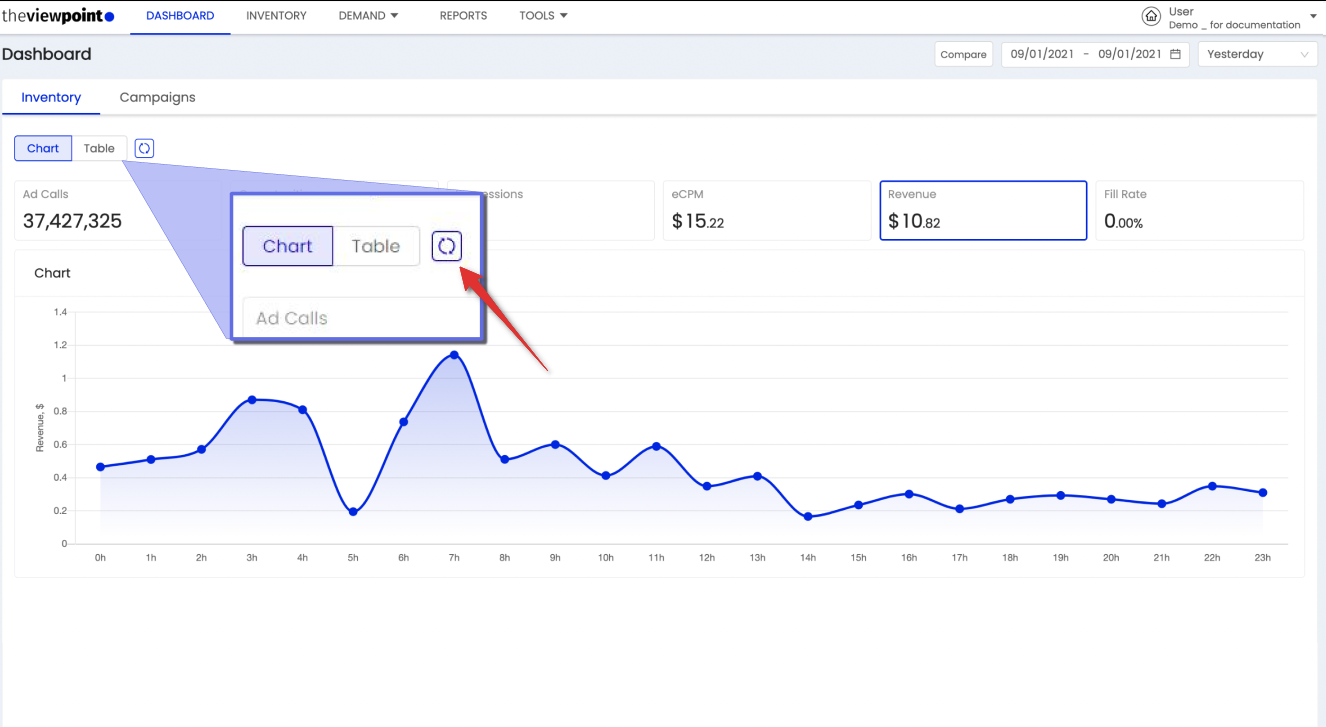
Only the most necessary information in an accessible format. Hourly reporting on the chart for 1 day or daily statistics if several days are selected.
Inventory tab
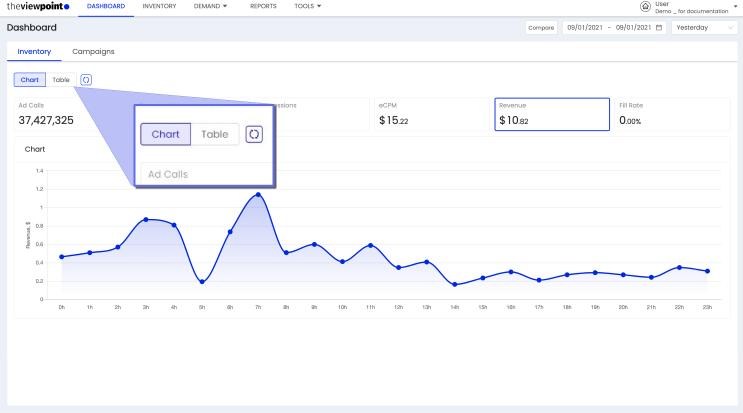
The Inventory tab displays key metrics related to inventory.

You can switch between Graph and Table views:
Metrics definition can be found here.
Campaigns tab
The Campaigns tab displays key metrics for all campaigns in your account.
By default, metrics are displayers for yesterday. The time range can be changed in the date picker.

If you need to view statistics for each campaign separately, go to the Table, which displays main metrics for the selected time period.
You can open the campaign you need to view/edit.
The metrics definition can be found here.